There’s a niche genre of music on the internet called “oscilloscope music”. This is electronic music that is designed to be visualized with an oscilloscope. Music visualizers have existed for a long time, but they often just display an image that represents the audio abstractly. Oscilloscope music allows the musician to draw arbitrary shapes using sound.
Compare this to the original video:
Here’s the finished project on Github.
How it Works
Oscilloscope music depends on a few simple properties of stereo audio and oscilloscopes. Stereo audio consists of two audio channels, left and right. Each channel is a sequence of audio samples that range from -1 to 1. An oscilloscope set to XY mode will use these two channels of data to move a “pen” of light around the screen. As the above video states, the left audio channel controls horizontal movement and the right channel controls vertical movement.
For most songs this will just result in a tangled ball of lines near the center of the screen. Many songs will have similar audio playing on the both channels, which will cause the lines to skew diagonally. Playing a regular song through an oscilloscope will result in a simple, though boring, music visualization. But a musician writing oscilloscope music can use the audio channels as a sequence of commands to move the pen around to deliberately draw images.
This project will simulate the behavior of an oscilloscope and let users see oscilloscope music in real time without Youtube compression artifacts.
Real Time Audio
The first step is to play the audio file and extract the sample data as it plays. To do this, we need a real time audio library. I chose to handle this using miniaudio. Miniaudio has a simple C interface and gives the library user direct control over every audio sample. It supports a decent range of audio file formats and can resample audio data on the fly.
This allows us to read audio data with minimal latency and ensure the data has a specific sample rate. Additionally, miniaudio provides some helpful types like a ring buffer for audio samples. That allows us to move data from the audio thread to the main thread with minimal overhead.
While many audio formats can be used, the best results come from an uncompressed audio file (such as FLAC or WAV) with a high sample rate. This project resamples all input to 192 KHz. At 60 FPS, this means one frame of rendered data will contain 192,000 / 60 = 3,200 samples.
Drawing Lines
Each audio sample contains two float values, the left and right channel. This sample can be interpreted as an (X, Y) coordinate. We can draw a line segment between each pair of points.
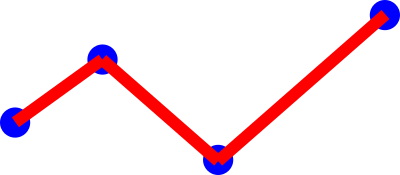
The blue dots are the (X, Y) coordinates from an audio sample. The raw samples only range form -1 to 1, so they must be stretched to fit the screen. Then rectangular meshes are generated to connect the dots.
A more advanced line renderer would include some kind of join between adjacent line segments, like a miter or bevel join. I chose not to do this since the lines for this oscilloscope app are very small and change quickly. The gaps between line segments are not visible in most cases.
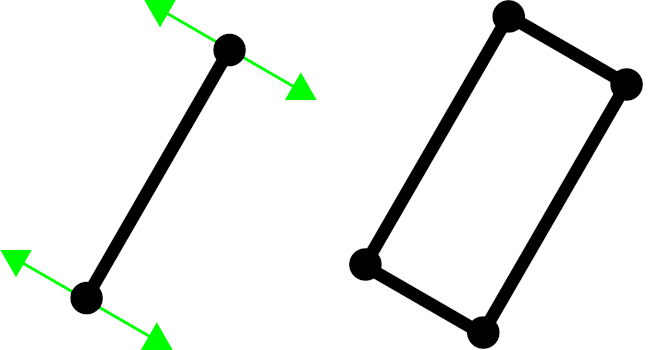
The mesh generation does not emit rectangles directly. Instead it emits four vertices that form a zero width line along the center of the line segment. Each vertex has a normal attribute that points perpendicular to the line segment. The vertex shader expands the vertices along their normals to create a rectangle. This allows the width of the line change without needing to change the geometry.
Generating a simple rectangle as the mesh would cause harsh aliasing on the edges, which would be visible, even if the image moves rapidly. Instead of using hardware MSAA, I decided to handle anti aliasing in the fragment shader.
The AA algorithm is a simplified form of Signed Distance Field rendering. For every pixel, the distance to the center of the line segment is calculated. This distance is subtracted from the width of the line segment, and the result is clamped to the range [0, 1]. This yields the alpha value of the pixel. (Width is the distance from the center to the edge)
\({alpha}={clamp}{\left({width}-{distance}\right)}\)Due to the aliasing of the pixel grid, this will cause a 1 pixel wide edge to have an anti aliasing effect, as different pixels will have their sample points at slightly different distances to the center line. Pixels closer to the center will approach an alpha value of 1. Pixels further will approach 0.
This has the added benefit of allowing lines to cross over each other without having to worry about how MSAA interacts with transparency.
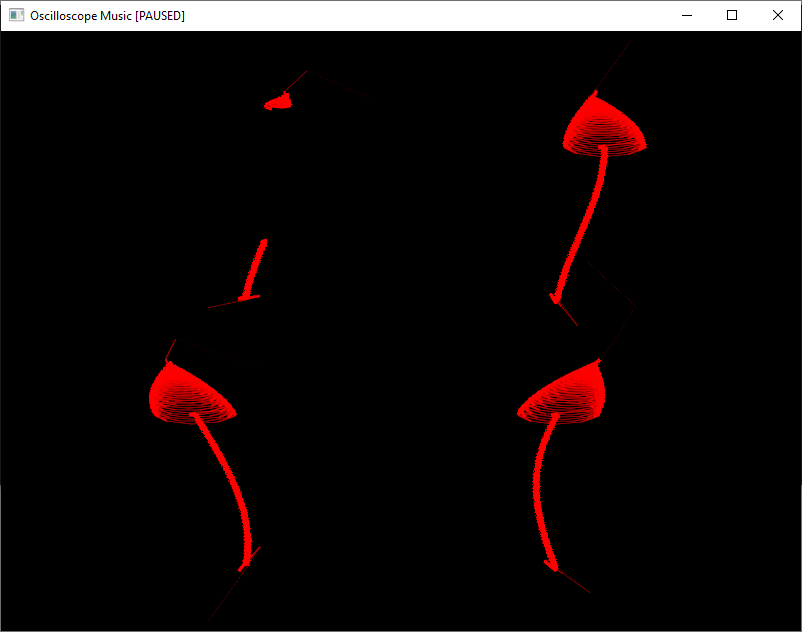
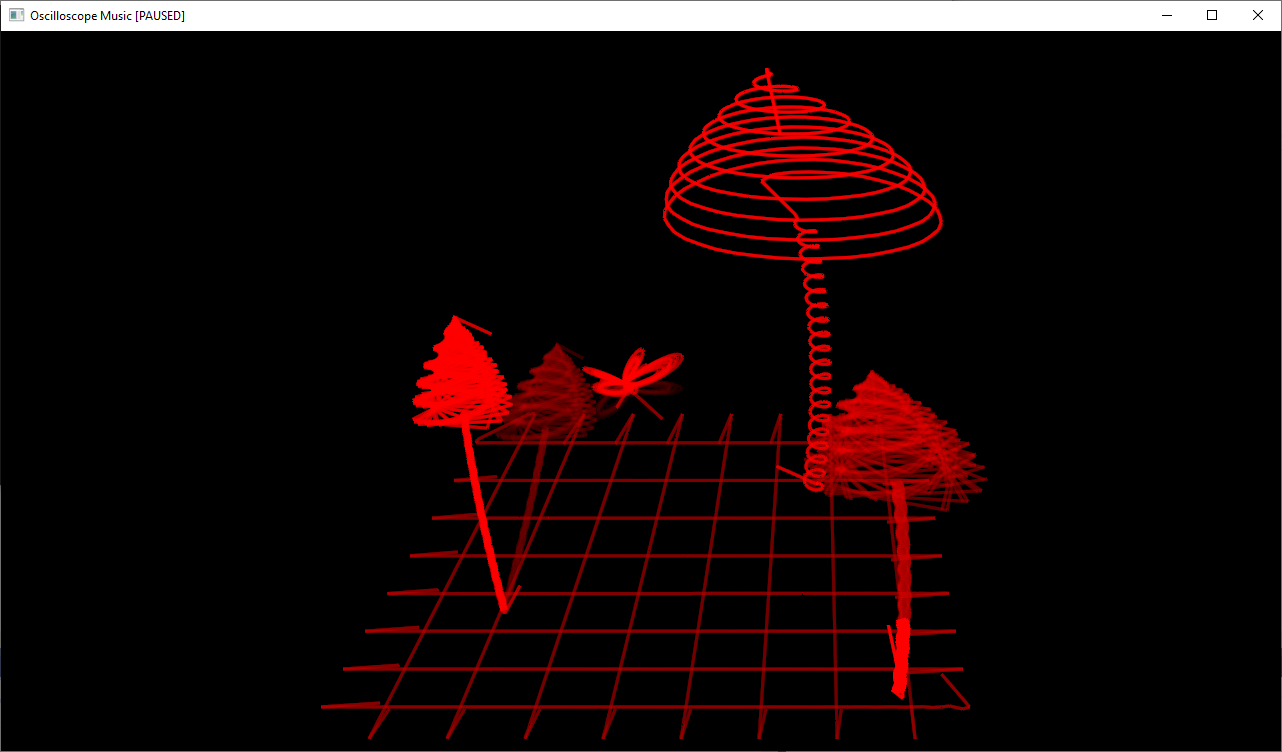
Another effect that is important for the oscilloscope look is changing the “power” of lines depending on length. When the drawing pen moves quickly, it should create thinner, dimmer lines. When it moves slowly, it should create thick, brighter lines.
Notice that the mushroom stalks and the butterfly’s body are bright. The mushroom tops and the butterfly wings are dimmer.
Since the audio samples are spaced evenly in time, we know how fast the pen moves from the distance between two samples. Using this, we can change the line segments to be thinner and more transparent when they are longer.
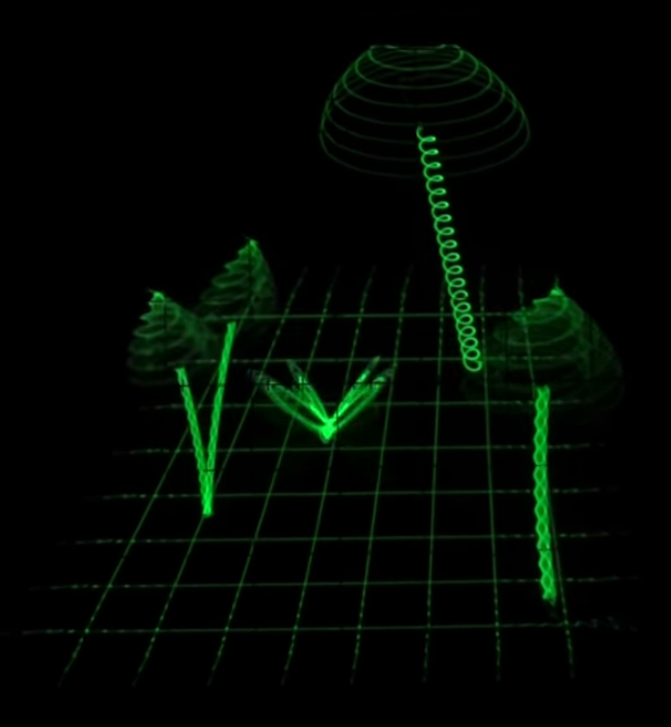
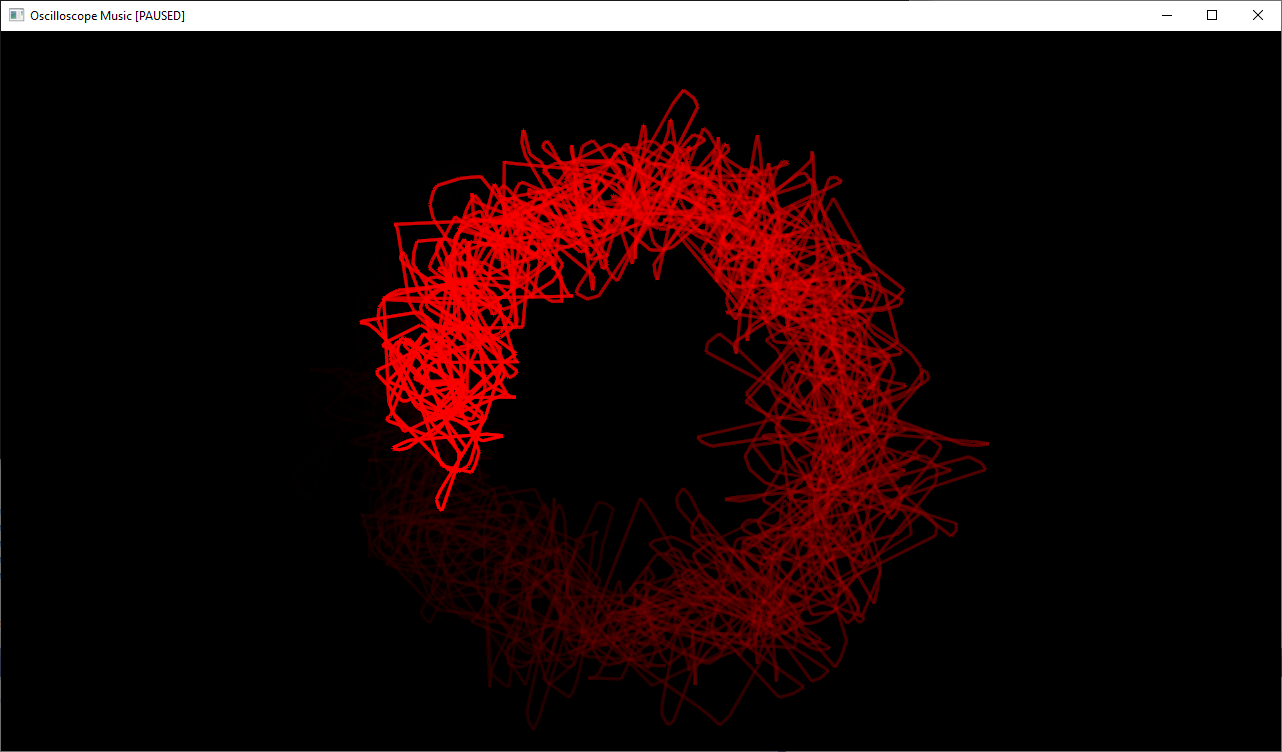
Oscilloscope music has no way to tell the pen to stop drawing. The original video relies on moving the pen quickly to draw distinct objects. This results in a line so thin and dim that it isn’t visible. We simulate this by not drawing the line at all if it’s dimmer than a threshold.
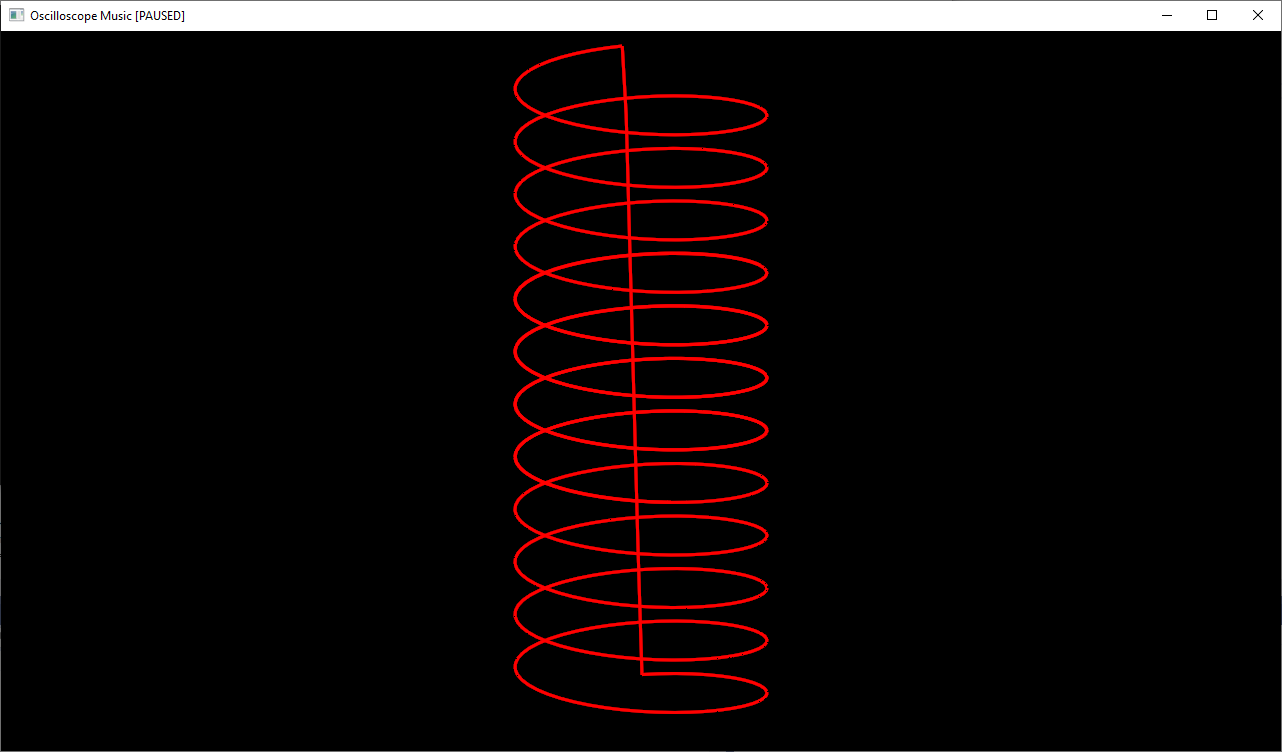
There’s a line in the center caused by the pen jumping from the end of the spiral to the start. The app now skips most of the center line since it’s dimmer than the threshold.
Persistence of Vision
There is a limitation to drawing only the most recent frame of audio data. Some of the images in oscilloscope music are drawn over multiple frames. The audio data rapidly switches between different images and relies on human persistence of vision to create a single image for the viewer.
Additionally, the images from the original video seem to linger for more than 1/60th of a second when running on a real oscilloscope. We need to simulate both of these effects.
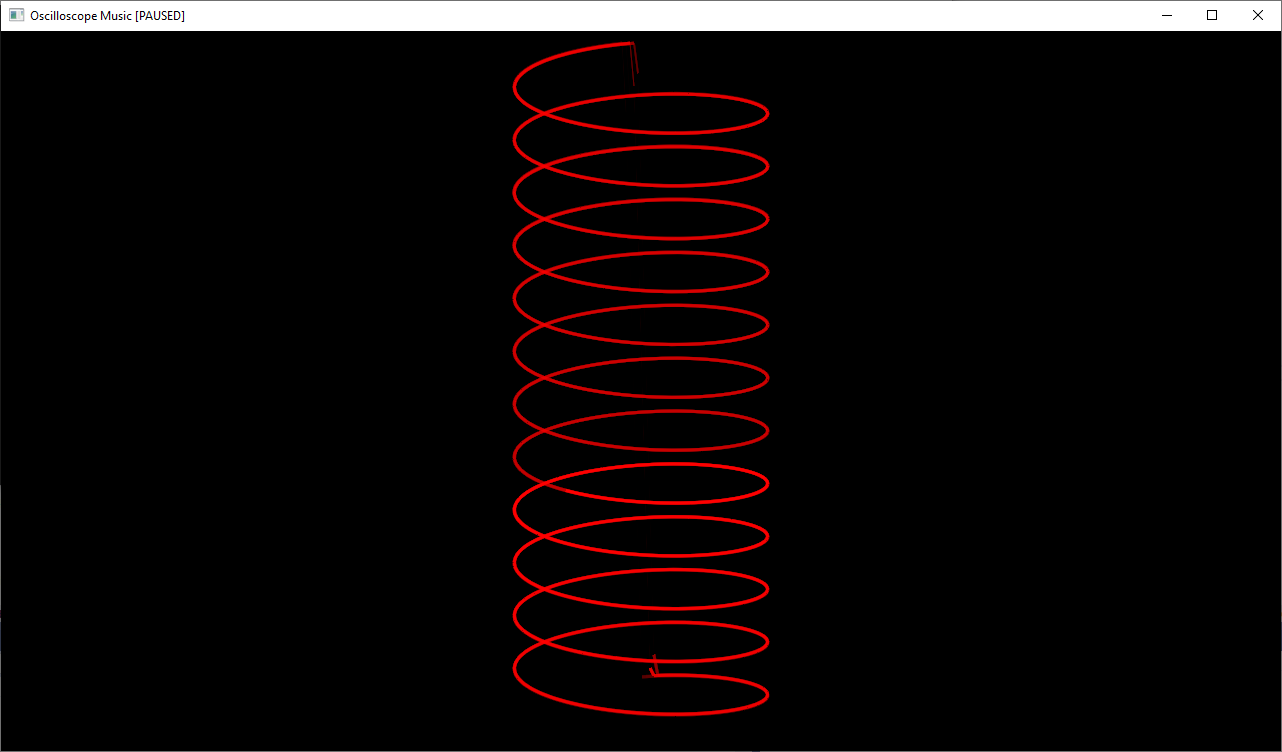
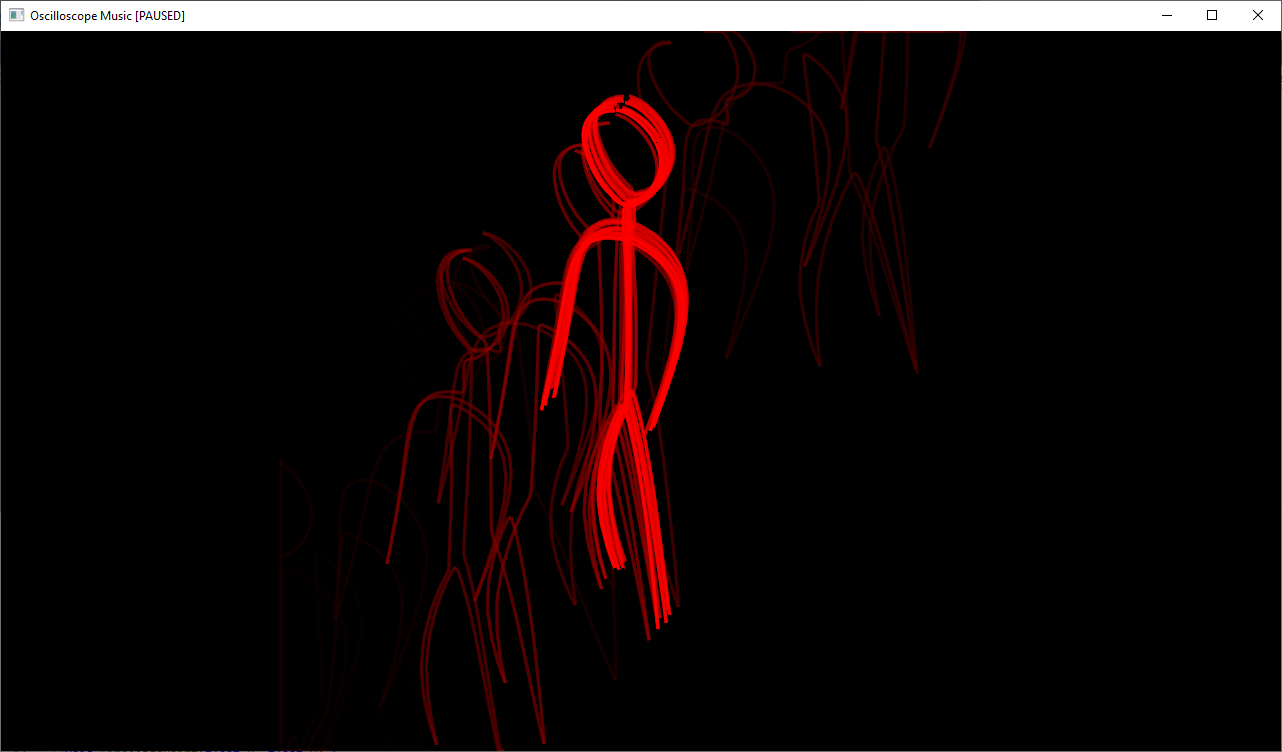
If you pause the app, you might see an image like this:
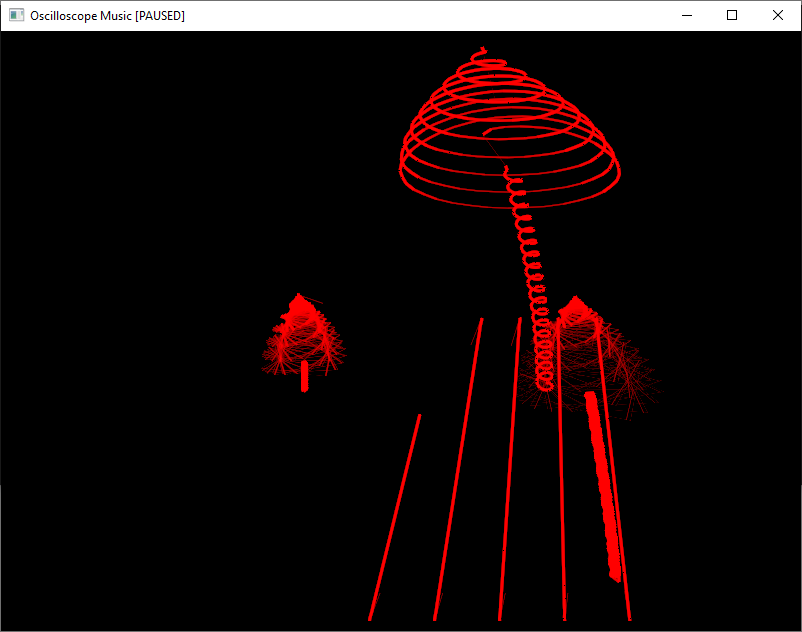
The song might space out an image over 4 or more frames. This can cause an uncomfortable flickering effect and can make it difficult to see the intended image.
The solution is to draw multiple frames worth of audio data. We use a buffer large enough to hold multiple frames. When a new frame is added, the oldest frame is overwritten. So instead of drawing 3,200 audio samples at a time, we draw 12,800.
The most recent data is drawn with maximum brightness, the less recent data is drawn with less brightness.
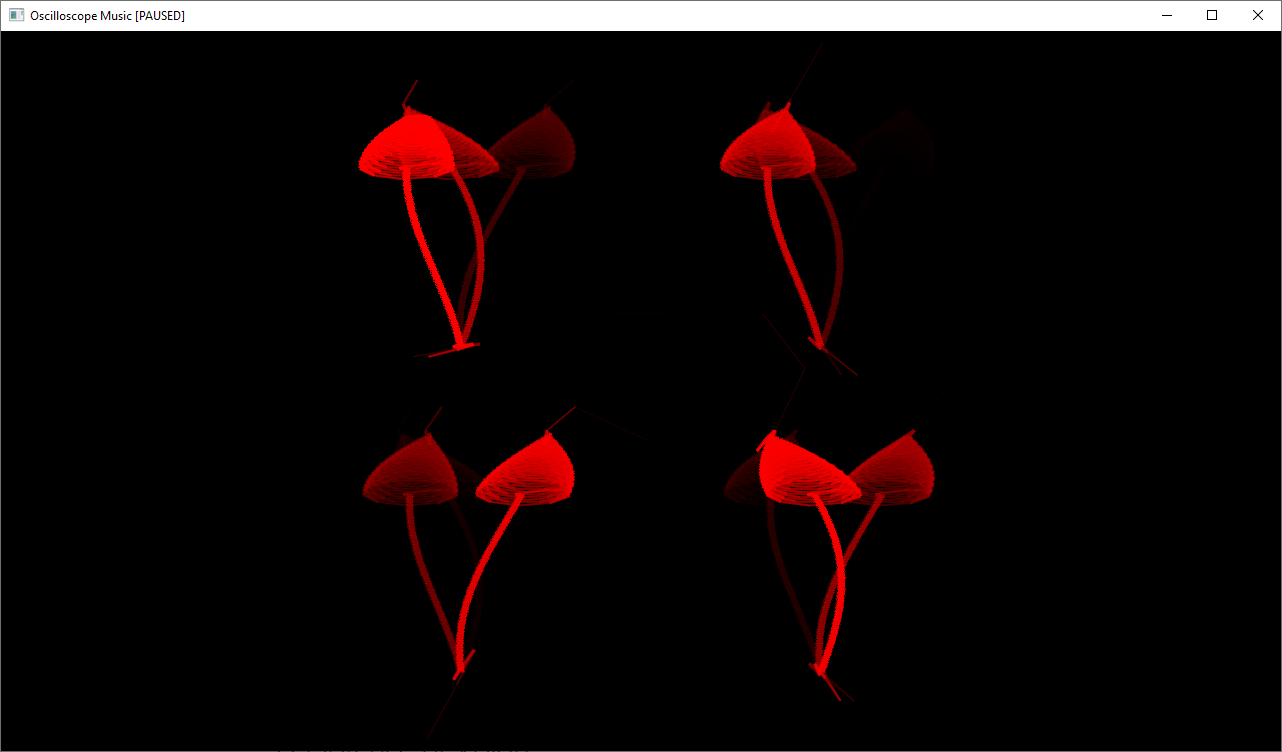
This doesn’t completely solve the issue for complex scenes like the field of mushrooms, but it helps.
Conclusion
Aside from Jerobeam Fenderson, there’s another musician called Chris Allen who also makes oscilloscope music.
The program is a command line tool. To use it, pass the path to the song as an argument:
OscilloscopeMusic.exe path/to/song.wav
There’s only one control once the player starts. Click to pause/unpause.
The supported audio files are whatever miniaudio supports. Right now that’s mp3, wav, FLAC, and ogg.
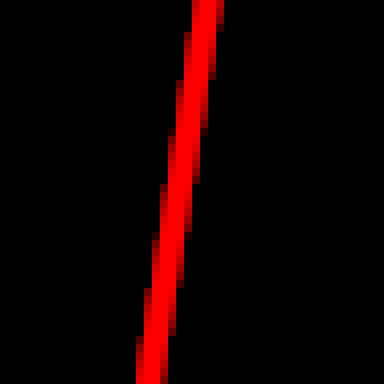
Any aspiring oscilloscope musicians out there can use this tool to test out their own songs. Here’s one I made in Audacity by playing a 60 Hz sawtooth on the left channel and a 600 Hz sine wave on the right channel:
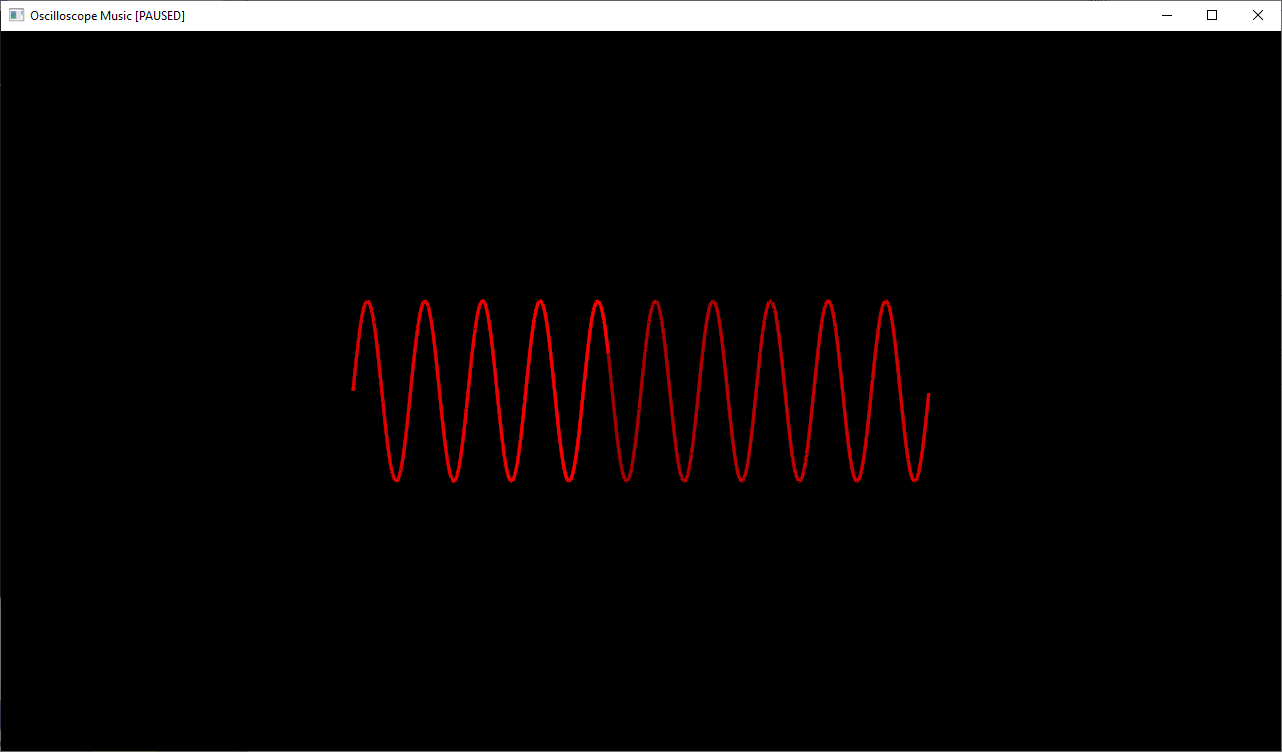
It sounds terrible, but it’s a start.